What You Should Know About Google Traffic
Notably, Google Maps has one of the most elaborate and comprehensive mapping databases. According to The Manifest, Navigation app users believe Google Maps gives the best directions. This database constitutes well over 1 billion kilometers spread across different parts of the world in more than 220 countries as well as territories around the world. Additionally, Google Maps has 154.4 million monthly users.
Google Maps has made it easy to do the following within a matter of seconds.
- Get Google traffic for your drive.
- Easily search for places.
- Quickly and easily navigate to a specific place.
For those that are new to using Google Traffice or want to optimize their usage, here’s an overall guide on what you should know about Google Traffice and how it works.
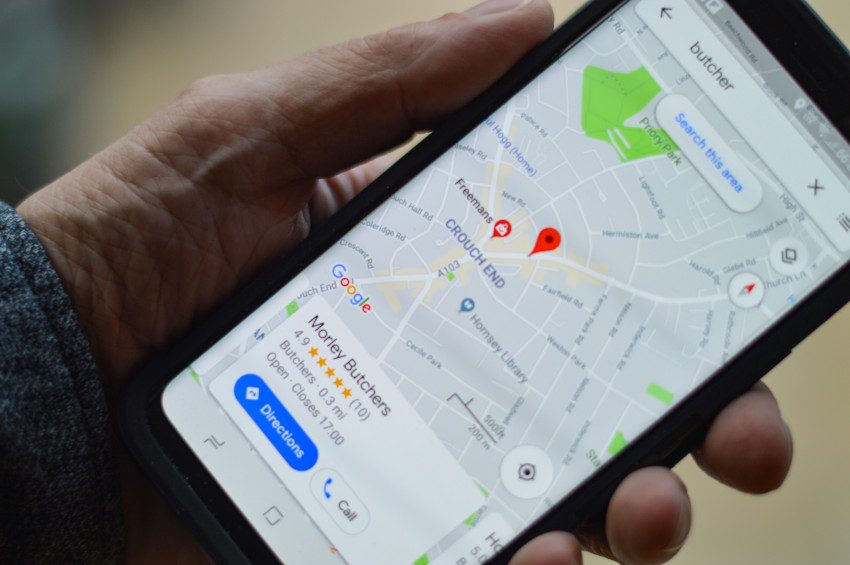
How to Get Google Traffic
- Open the Google Maps app on your phone.
- Tap on the “Go” tab at the bottom.
- Scroll to find your trip and pin it. You can also select a trip option from your past activity.
On the “Go” tab, you will find information relevant to Google traffic, such as estimated travel times, recommended and alternative routes, as well as traffic delays along the route. We should note, Google Maps uses 5MB of data per hour.
What goes into bringing you all this information in a matter of seconds is quite complex. Here is a behind-the-scenes look at the workings of Google Maps.
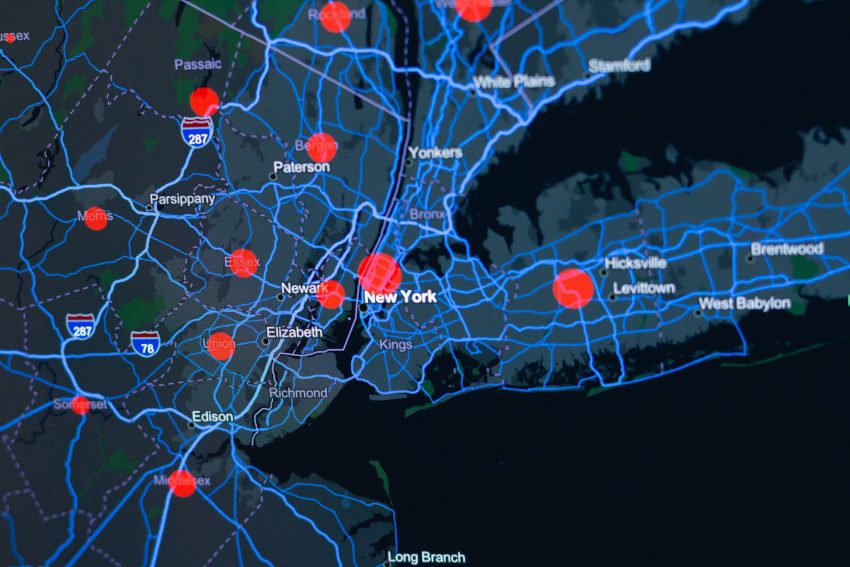
Google Traffic: How Traffic Jams Appear on Google Maps
On the Google Maps app, you will see green, orange, and red-colored streets. Green roads represent normal moving traffic at any given time. On the other hand, orange and red represent slowdowns.
These slowdowns will register when Google Maps users in navigation mode are driving at less than usual speeds. However, it remains unclear just how many of these slower-than-usual users it takes to get to the threshold for the app to register the traffic flow as slow.
At the same time, it is worth noting that the app doesn’t treat all vehicles the same. Indeed, in some regions, Google Maps can differentiate between a motorcycle, car, and other vehicles.
As such, the app will not automatically adjust the traffic flow status from slow to normal just because a scooter successfully weaved its way through the traffic. In reality, given its sheer size, a scooter can get through even when traffic is at a standstill.

What About Other Traffic Incidents?
Users can easily report, in real-time, accidents, speed traps, construction zones, and other incidents which may influence traffic. You can do so with the following easy steps.
- While in navigation mode on the app, tap the “+” icon. This should be the third icon you will come across on the app’s right-size menu.
- Choose and tap on the icon for the specific type of incident you’d like to report.
- Follow Google Map’s instructions to submit your report.
If you’d like to cancel submitting your report, you have the option of doing so within the provided short window of time before your report is added to the app.
Powered by Drivers
Drivers all across the globe navigate with Google Maps every day. In fact, the sheer number of users, and by extension, the amount of data it has, is a primary advantage Google Maps has over other GPS mapping apps.
Every iPhone and android phone with Google Maps open sends out anonymous bits of data to Google. The app refreshes automatically based on this user data, which is tracked anonymously. Over the years, Google has worked to improve its analytic tools for analyzing this data. With attention to details such as the total number of cars and how fast they are going, Google will analyze this data provided by drivers.
When navigating with Google Maps app, you can better understand current traffic conditions using aggregate location data. However, this data will only help you to get and understand current traffic estimates. For instance, it will help you to see whether or not a traffic jam will affect your drive in the present.
The information does not provide insights on what your traffic predictions and traffic incidents will look like 10 or 20 minutes into your drive. In the light of these inadequacies is where technology, specifically machine learning and artificial learning, comes into play.
Combining Advanced Machine Learning Techniques and History for Traffic Prediction
Google Maps uses an analysis of its database of historical traffic patterns to make traffic predictions. Actually, these are sets of data showing the road conditions on specific roads at specific times.
For example, these patterns may show that the average speed of cars on the highway headed to the part of town with many business offices is around 65mph in the window between 6-7 am and maybe into the next hour. Most drivers will tend to slow things down, driving at around 20mph the rest of the day, especially in the late afternoon.
Coupled with the collected user data and live traffic conditions, Google Maps’ machine learning algorithm can use these historical patterns to predict the possibility of a slowdown. That’s right. The app can predict whether you’ll be affected by a slowdown that is yet to happen.
Actually, Google Maps has recently updated its predictive traffic models. These updates are essential to accommodate shifts in driving patterns and behaviors observed since the start of the global COVID-19 pandemic. The models prioritize the most recent historical patterns, covering a window of two to four weeks over historical patterns from a prior time.
Route Selection

Traffic predictions are, of course, an important factor to look at for route selection. Equally important, there are other factors such as road quality. For example, unpaved surface roads covered in dirt, mud, and gravel, would be more difficult to drive on, compared to a paved ones. Therefore, such a factor would be a consideration before recommending a particular road.
Again, Google Maps will consider the directness of a road as well as its size. Indeed, it’s easier to drive down a highway than using a smaller road with several stops.
Additionally, Google Maps will factor into its recommendations authoritative data provided by local highway authorities and local government officials. Such information includes imposed speed limits, restricted movement, tolls, and more.
Lastly, as noted already, real-time feedback from road users is something to consider. Google Maps will recommend alternatives if there are any incidents on any part of your route.
Reroutes and Calculation of ETAs
Google Maps compares user speeds with authoritative speed limit information to calculate the estimated time of arrival. What’s more, the app will look at how fast you and other drivers are moving and compare it to how fast you should be going.
Again, Google will factor in user-reported live traffic conditions and incidents and adjust your ETA accordingly. Also, the app will evaluate the severity of any user-reported traffic incidents resulting in a slowdown. And, based on a calculated estimate of the slowdown duration, it will recommend alternative routes.
Indeed, improvements to Google Maps predictive capabilities have paid off. In fact, Google has been able to significantly cut its inaccurate ETAs in Washington DC, Berlin, Tokyo, Sydney, and Sao Paulo, just to mention a few places.
Google Traffic on Your Digital Signage
Get full-service digital signage systems and enjoy the many benefits of API integration with Google traffic. You can share the latest Google traffic updates in real-time on your digital signage screens. Your employees, customers, and other visitors can see the current traffic conditions, any congestion, accidents, or road closures. This is no doubt crucial information, which will inform their route selection.
In Conclusion
Determining an optimal route, travel time estimates, and predicting traffic are all very complex. Enter the powerhouse that is Google Maps, and you can have this information within seconds. Understanding what happens behind the scenes should inspire confidence in the information you get as reliable.
Want to learn more about digital signage? Click here to read more articles on our Digital Signage Insights page!

