Digital signage offers a powerful way to display Power BI reports, but not all data is relevant to every audience. By using a location-based filtered view, businesses can ensure the right insights reach the right people at the right time. This is managed by displaying segmented data to specific locations, all from a single report.
For example, a company with offices in Virginia and New Jersey can display state-specific data on screens in each location—Virginia offices would only see Virginia’s metrics, while New Jersey offices would view their own.
This location-based segmentation enhances decision-making, reduces information overload, and ensures that employees, customers, or stakeholders see only the most relevant data.
What You’ll Need
- An Mvix CMS Account
- Internet Connectivity
- An Active Signature Care Plan
- Your Power BI Report Data
This feature works by assigning parameters to your device so that data within a report can be segmented. To begin, you’ll want to identify which specific segment in your reports you’ll want to use. For this example, I used a report that will be segmented by location.
Configuring Your Device
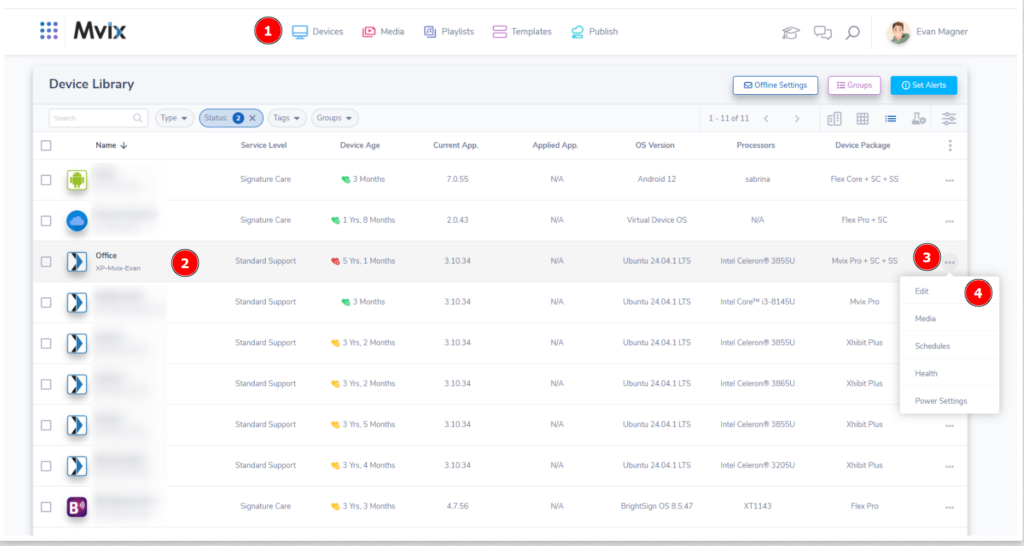
- First you’ll need to access the device library from the (1) “Devices Module”.
- From there, (2) locate the device you’ll want to show a segmented part of the Power Bi Report from.
- Then, (3) click on the 3 dots at the far-right and (4) select “Edit”.
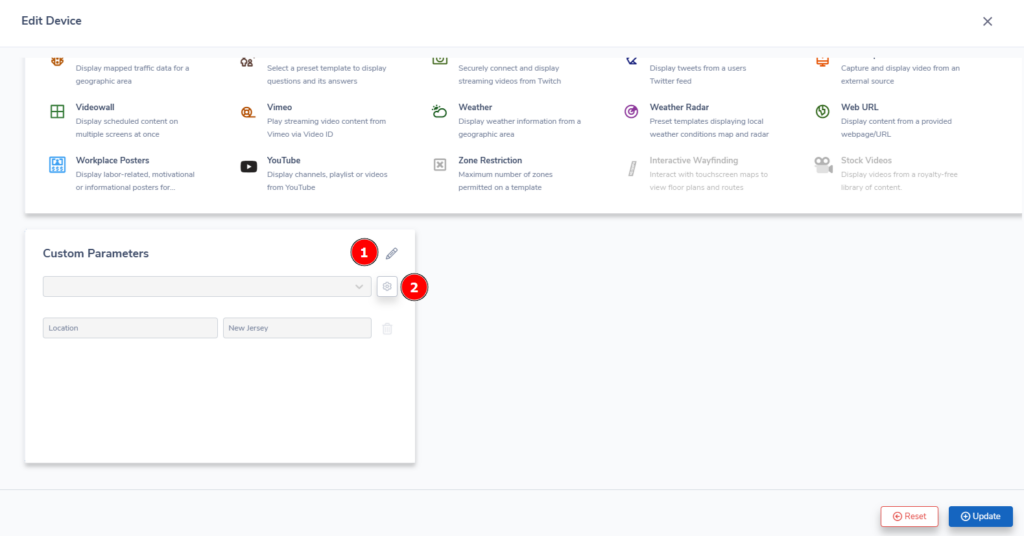
- Once the “Edit Device” page loads, scroll to the bottom to find the “Custom Parameters” section.
- (1) Click on the pencil icon to allow editing then click the (2) gear icon to add a new parameter.
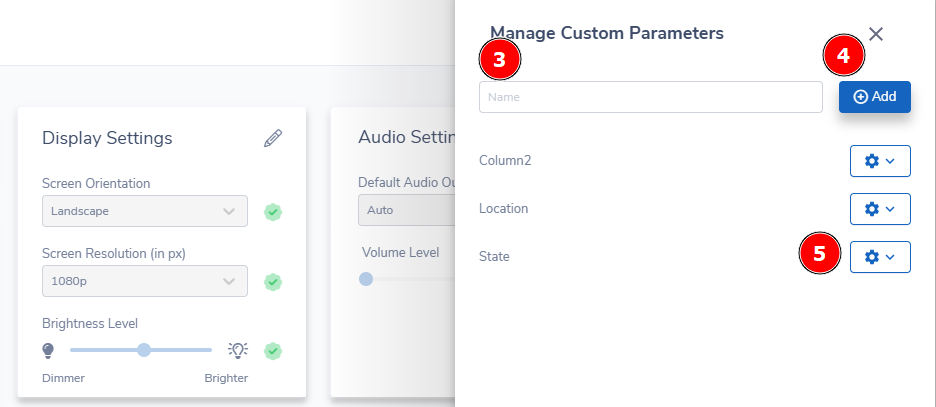
- The above “Manage Custom Parameters” sidebar will then load.
- In the (3) name field, use a broad term so it’s clear during the Power BI Media setup. For this example, we used “Location” as we are segmenting by specific locations.
- Then (4) click “Add” to add the media to your device parameters. If you would like to edit or delete any parameter, (5) click the gear icon.
- To exit, click the “x” symbol at the top-right.
- You’ll be brought back to the “Edit Devices” page once you exit the “Manage Custom Parameters” section.
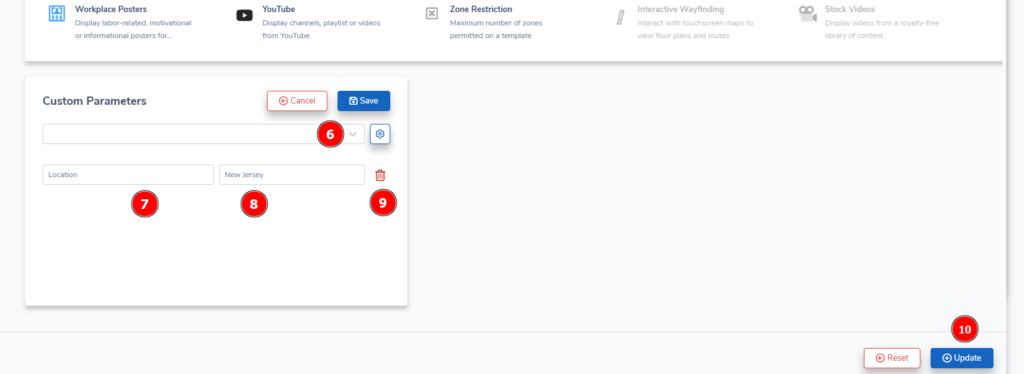
- Now, when you (6) select the drop down, you’ll see the parameters you have on the device.
- Click on the one you want and it will automatically generate a new line with the (7) parameter on the left.
- In the (8) next field, this is where you want to put the segment. This needs to be based on what is exactly in the report and is case-sensitive.
- If you would like to delete the parameter, (9) click the trash can button on the right.
- Once you have finished selecting the parameter, (10) click “Update” on the bottom-right.
 Important Note: Parameters are saved across your account. As such, you won’t need to set this for each individual player. Instead, skip steps 3-5 and continue as shown above.
Adding Your Power BI Media
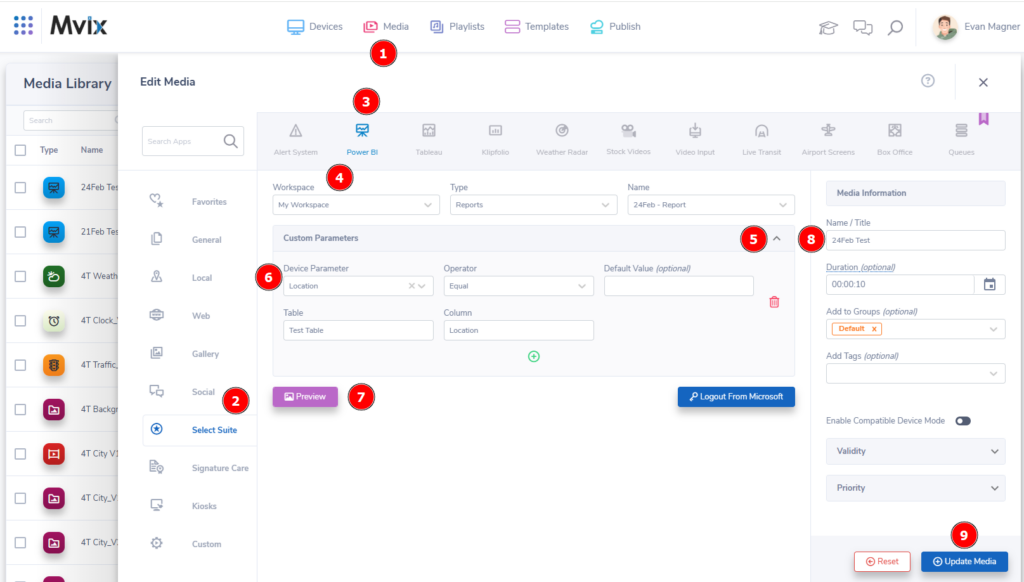
- From the “Add Media” module located under (1) media, find the Power BI App by (2) clicking Select Suite and (3) selecting “Power BI”.
- Next, (4) select the Workplace, Report Type, & Name of the report you will be segmenting.
- You’ll then need to (5) click the drop-down for custom parameters to enter the required information.
- For each section, the following information is needed:
- Device Parameter: This is the parameter you created in the previous step.
- Operator: This is used to further segment based on the column. We recommend keeping this as “Equal”.
- Default Value: This is an optional field if you would like to set a specific value. It is recommended to leave as blank as the report will pull the value directly from your Power BI data.
- Table: This is the name of the table you are pulling from. This needs to exactly match what is on your Power BI report.
- Column: This is the column you will be segmenting. You will also need to put the exact Column in your report you are segmenting.
- Please note that (7) clicking “Preview” will not show the segmented data. This is due to it being filtered at the device level.
- Lastly, (8) name your device a name that will be easy to reference, then (9) click on “Update Media” to add this to your media library.
Important Note: Make sure not to toggle on “Enable Compatible Device Mode” in the media information section. This will disable any parameters to be read by the device.
Publishing Your Media
- From here, schedule & publish the media as you would normally.
- While this example only showed one player, you can publish this to multiple screens and the data will automatically segment depending on the parameters you have set on individual devices.
- If no parameter is set on the device, the entire report will show.
Problems, Questions, Corrections: If you have any further questions, problems, or corrections you would like to see made, please open a support ticket.
