With the Analytics feature on Mvix CMS, it allows you to display company analytics on your digital signage screens. According to Oracle, business analytics focuses on using insights derived from data to make more informed decisions that will help organizations increase sales, reduce costs, and make other business improvements. The Analytics feature displays important data, metrics, KPIs, and more to keep your employees informed and important numbers to reach goals. In this knowledgebase article, you will learn how to convert your Excel document to a readable file to display on your digital signage.
Markets That Can Use the Analytics Feature
There are a number of markets that can benefit from displaying analytics. Here are some examples of how it can be used:
- Hotels: Analytics of booked rooms and event spaces, sales goals achieved month-by-moth and more
- Healthcare: Analytics that can be displayed include patient visits, OR bookings, and daily operations metrics
- Manufacturing: Analytics of income/outcome shipment, goals for the month and year, downtime to worktime comparisons, and more.
- Corporate Solutions: Analytics of company metrics, account data, sales reports, and more
To use the Mvix CMS Analytics feature, your data needs to be properly formatted. Here is how to format data so it can be uploaded to the CMS.
What You’ll Need:
- A compatible digital signage player e.g. Mvix, BrightSign, etc.
- CMS Software with a supported feature package
- Internet Connectivity
- Google Sheets, Microsoft Excel, or another spreadsheet application.
If you meet the requirements listed above, simply follow the steps below to learn how to format your analytics data for use with the Analytics feature.
Format Data in the Excel Sheet
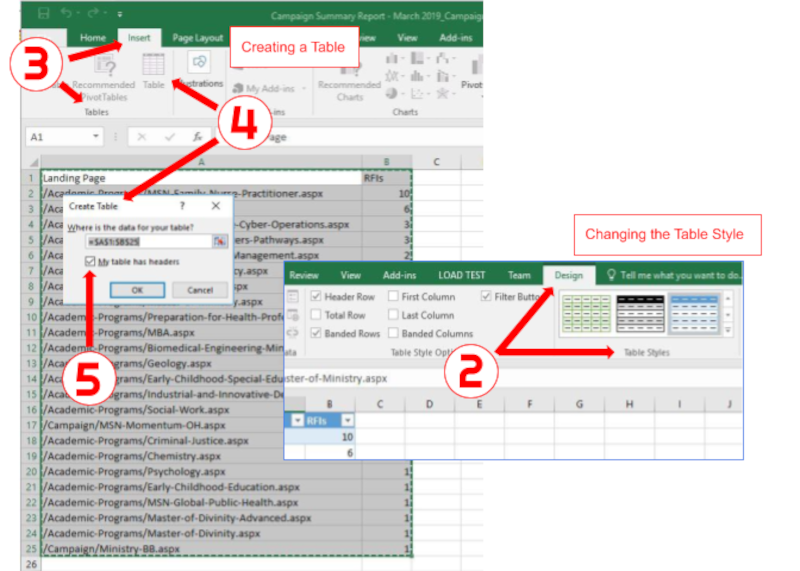
- Open the Excel spreadsheet.
- Select the cells that contain the information for the table.
- Click the “Insert” tab >. Locate the “Tables” group.
- Click “Table”. A “Create Table” dialog box will open.
- If you have column headings, check the box “My table has headers”.
- Verify that the range is correct > Click [OK].
- Resize your columns to make the headings visible.
- Export your file into a readable file type by our system: CSV, XML, or JSON.
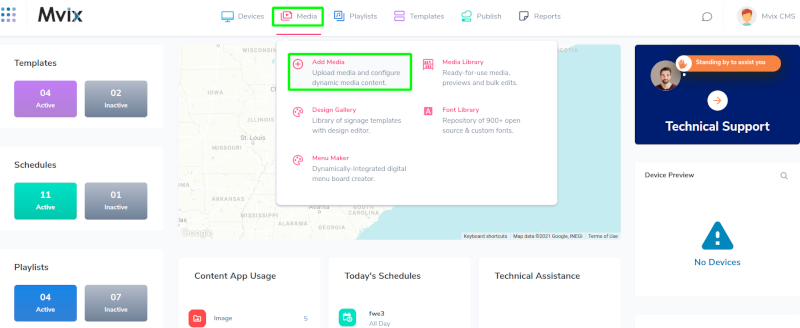
- Navigate to the CMS
- Hover over the “MEDIA” tab and click “ADD MEDIA”.
- Click the “GENERAL” category and select the “ANALYTICS” app.

- Upload the particular file. Select the orientation you would like your data to format in.
- Please note, that some data orientations may require additional formatting. We supply sample files of each Filetype under the orientations, so please check these if you note any issues.
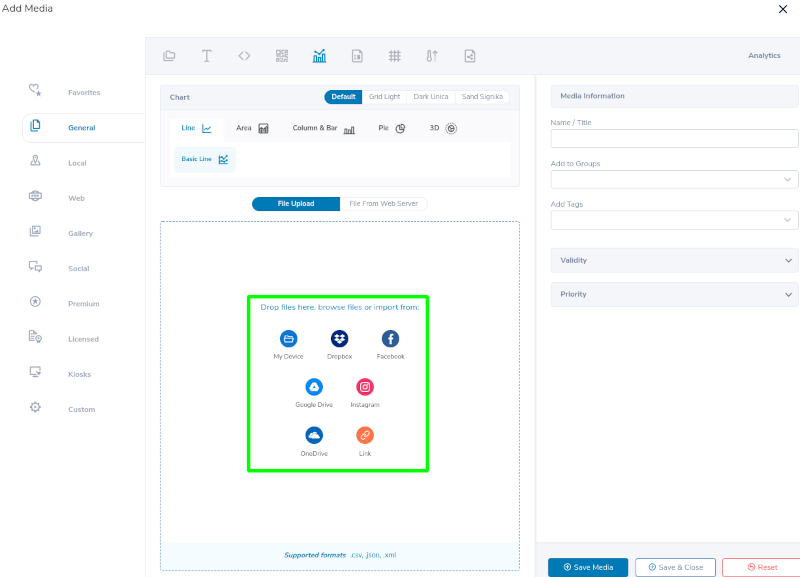
- Set the Axis titles to label your graph
- You can also adjust subtitles as necessary for additional information
- Name the media and save it to your Media Library.
Solutions to Display Digital Signage
Digital Sigange Solutions should be your tool to display metrics and boost productivity and engagement. Here are some solutions to display our Analytics Feature:
- Production/Metic Displays
- Meeting Room Signs
- Lobby Signs
- Breakroom Signs
 Problems, Questions, Corrections: If you have any further questions, problems, or corrections you would like to see made, please open a support ticket.
